
QVT
Background
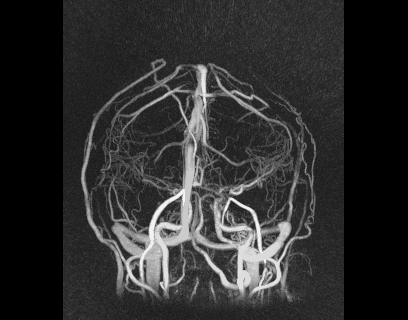
4D flow MRI is a time-resolved, 3D phase contrast imaging technique with three-directional velocity encoding that allows for non-invasive acquisitions of volumetric velocity vector fields. In other words, 4D flow MRI can show movement and direction (typically blood) within the brain. By obtaining blood velocities, we can calculate blood flow and other hemodynamic parameters, which have been used to diagnose and characterize a wide range of intracranial disease, such as aneurysms, arteriovenous malformations, and even vascular dementia.
Despite great advances in 4D Flow MRI acquisition and reconstruction, efficient and repeatable post-processing for cranial 4D flow MRI datasets is still quite challenging. The high dimensionality of the reconstructed datasets (1 temporal, 3 spatial dimensions, and 3 velocity directions) and the complexity of the brain vasculature (which often requires the simultaneous analysis of numerous vessels) can lead to prohibitively long post-processing times. Typical processing steps usually require manual vessel segmentation and manual placement of double-oblique tangent planes for hemodynamic analysis, approaches that are impractical when analyzing numerous vessels across a large number of datasets. User-dependent manual segmentation and plane placement also reduce the reproducibility of 4D flow MRI-derived hemodynamic parameters.
In 2015, Eric Schrauben (alumni of Wieben Lab) worked with the Umea University 4D flow group in Sweden to develop a semi-automated post-processing tool, which was named the Centerline Processing Scheme (CPS). The result from this collaboration resulted in a paper and this tool was used by some of our collaborators working on cranial 4D flow MRI.
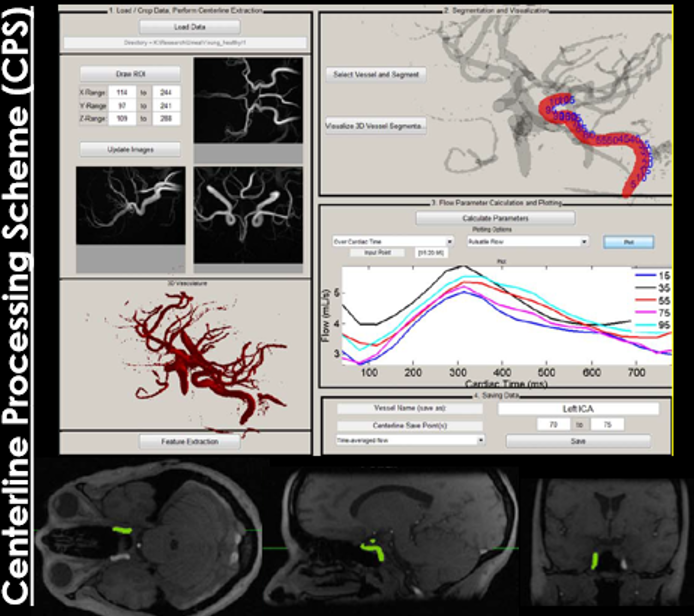
However, there were still some shortcomings associated with this tool. First, the vessel selection tool used a 2D image display to locate vessels of interest and it was often very difficult to select small vessels (particularly the ACAs and the PCAs). Second, the data loading, segmentation, and parameter extraction procedure was relatively inefficient. Thirdly, the 3D vessel display was cumbersome, making it hard to to visualize the full vasculature. Lastly, there were no save points, meaning that if you had to reload a case, you had to start from scratch. To address these issues, Carson Hoffman (now Wieben Lab alumni) and I reworked the entire code, keeping the overall pipeline the same while optimizing functions and adding visualization features to increase usability. This was ultimately transformed into a completely functional GUI, which we call the Quantitative Velocity Tool (QVT). [Full disclosure here, Carson contributed a significant amount actual development of the code and visualization tools, I helped with some smaller features initially]. One of the most unique features of this tool is the 3D vessel selection window, which allows a user to rotate/zoom/pan a 3D representation of the cranial vasculature (centerlines) in order to locate vessels of interest for hemodynamic analysis. This interactive interface also color-codes the vessel centerlines by flow, pulsatility, or any other hemodynamic parameter of interest, allowing one to visualize these parameters across the entire vasculature, not just at 1 location. We can also make show the semi-transparent angiogram overlayed on the vessel centerlines, which shows what the vessels truly look like in 3D space. Additionally, we created a real-time control window, which shows 2D cut planes and flow curves at selected vessel points. This window is updated when a user selects a new vessel location of interest in the interactive window.
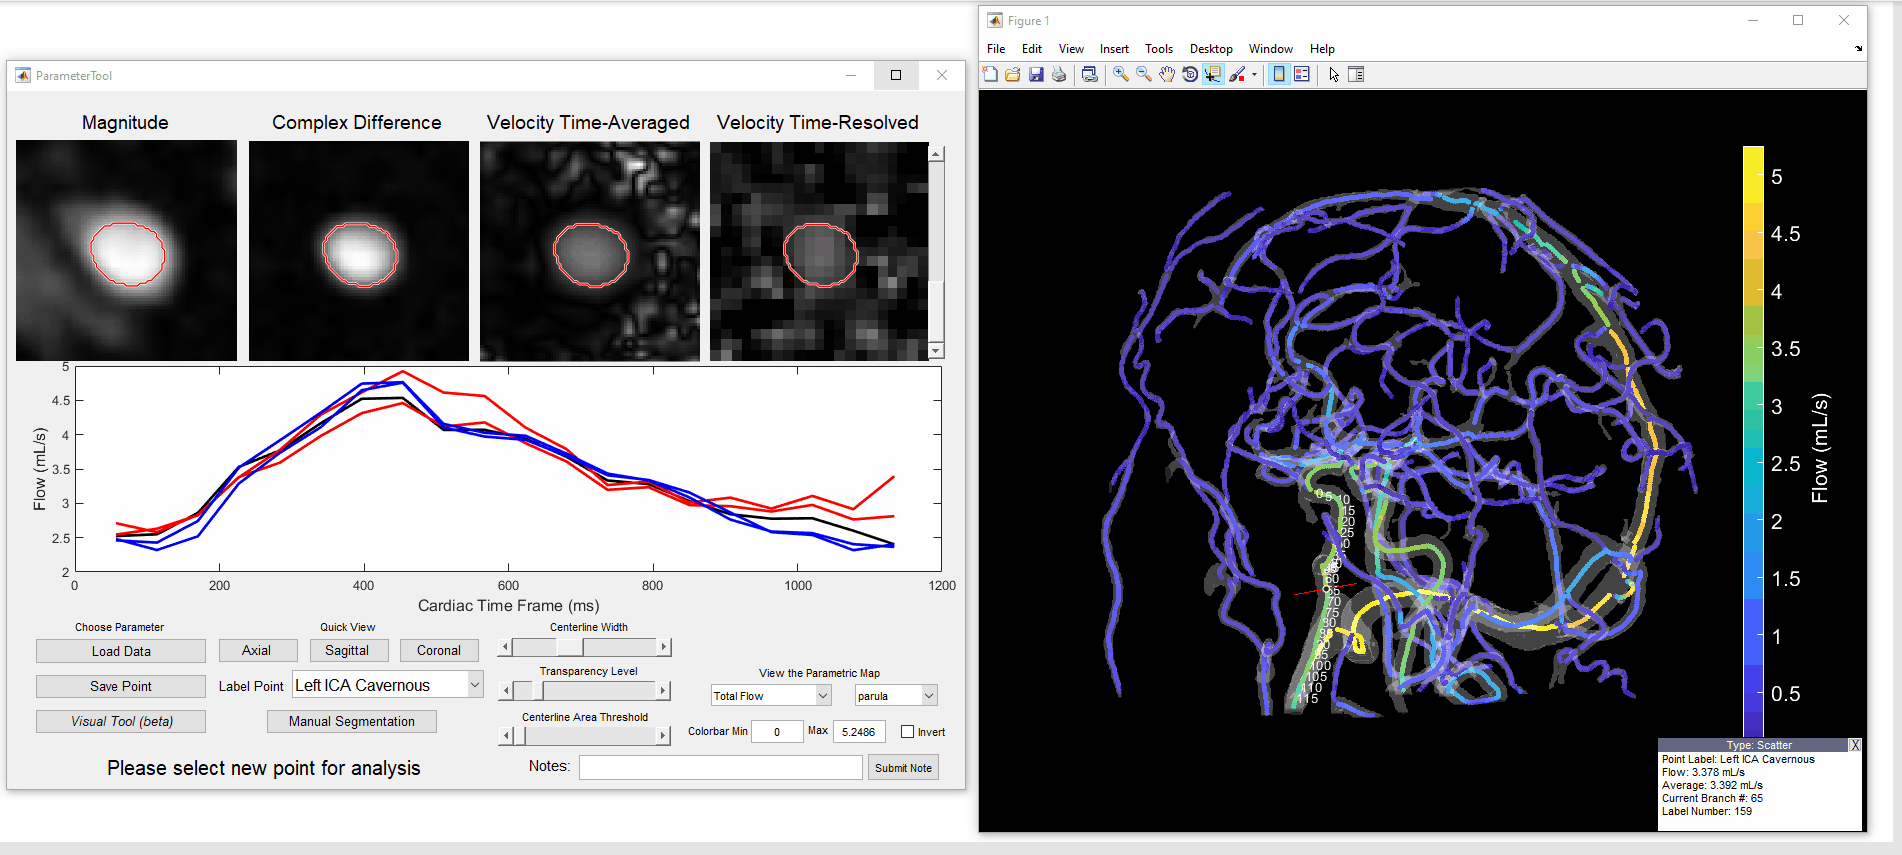
We also developed a visualization tool that is pretty awesome and has a lot of functionality. It’s not worth describing in words, so I’ll just show some images below.
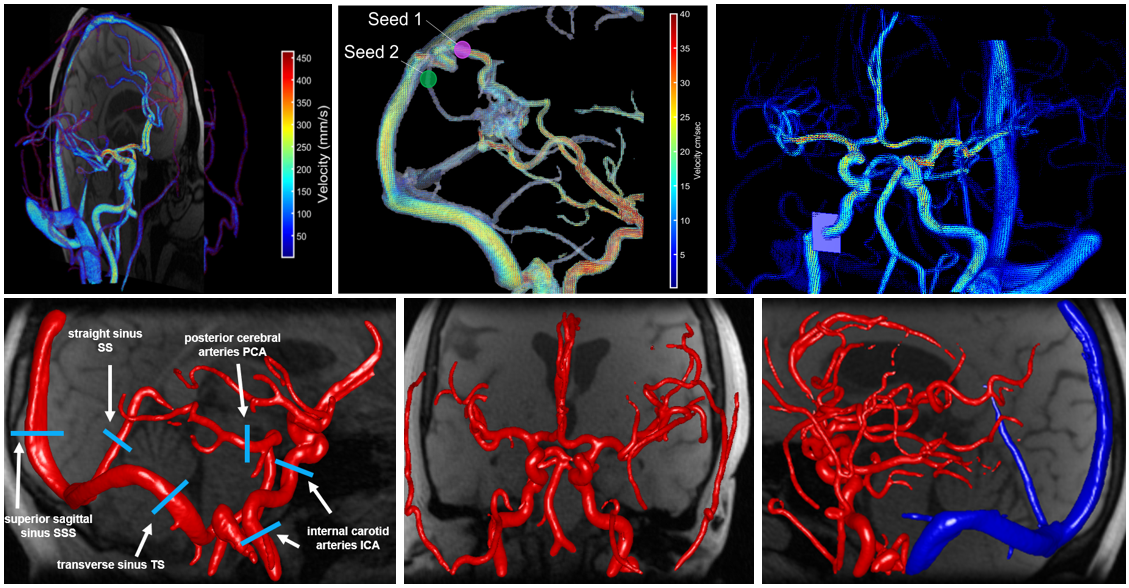
Another major change we made was the vessel segmentation procedure. The older centerline processing scheme (CPS) used k-means clustering for in-plane vessel segmentation, which would often under-segment the vessel in cases of non-uniform laminar or turbulent flow. This was addressed using a fully-automated local thresholding method, called the sliding treshold method. We validated this segmentation in a phantom, where the vessel areas from our segmentation method where compared to areas obtained from a ground-truth high-resolution CT scan. In the same cranial flow phantom, we compared our measured flow values (which is determined by our segmented vessel areas) to ultrasound flow values measured at the inlet of the flow phantom. In summary, vessel areas derived from our new sliding threshold method were strongly correlated with ground-truth CT segmentations while the older k-means method consistently underestimated vessel areas. Additionally, ultrasound flow was also strongly correlated with our flow measures. Lastly, we applied both the old tool (CPS) and the new tool (QVT) in 10 healthy volunteers to evaulate the total process time of each tool and how consistent flow was along straight vessel segments and at vessel junctions (where flow should be conserved). We found that our tool was significantly faster, decreasing total post-processing time by nearly 10 minutes, and that flow was more internally consistent using our new segmentation method.
More recently, we utilized this tool for the normative project, in which 759 cranial 4D flow exams were analyzed. With this tool, post-processing times were around 5 minutes per case, making our new analysis tool well-suited for large-scale flow studies (and really would not have been possible with the older CPS tool). For this study, I added several other features including visualization of time-resolved velocities in the 2D cutplanes, options for manual vessel segmentation, flexibility for loading HDF5 files, better data saving, and visualization improvements.
Code
Abstracts
Oral Presentation
- Hoffman, C. A., Roberts, G. S., Berman, S., Eisenmenger, L. B., & Wieben, O. Towards Automated Cranial 4D Flow Cranial Analysis. Society for Magnetic Resonance Angiography (SMRA) 31st Annual International Conference; 2019 August 27; Nantes, France.
- Jolicoeur, B. W., Rivera-Rivera, L. A., Roberts, G. S., Eisenmenger, L. B., & Johnson, K. M. Denoising 4D-Flow using Self-Supervised Deep Learning and Its Effect on Test-Retest Reproducibility. 2023 ISMRM and ISMRT Annual Meeting & Exhibition; 2023 June 3; Toronto, ON, Canada.
Poster Presentation
- Hoffman, C. A., Roberts, G. S., Berman, S., Eisenmenger, L. B., & Wieben, O. Automated Cranial 4D Flow MRI Analysis. Alzheimer’s Disease and Related Disorders Research Day 2020; 2020 March 5; Madison, WI, USA.
- Roberts, G. S., Johnson, K. M., Hoffman, C. A., Eisenmenger, L. B., & Wieben, O. Automating Background Phase Correction in Cranial 4D Flow MRI. Society for Magnetic Resonance Angiography (SMRA) 31st Annual International Conference; 2019 August 27; Nantes, France.
- Jen, M., Nishant, V., Cheng, K. P., Roberts, G. S., Laluzerne, M., Frank, J., Williams, J., Ludwig, K., & Johnson, K. M. Evaluation of Relationship Between Trigeminal Nerve Stimulation and Hemodynamics using 4D-Flow MRI: A Pilot Study in Swine Model. 2023 ISMRM and ISMRT Annual Meeting & Exhibition; 2023 June 3; Toronto, ON, Canada.
Manuscripts
Accepted
- Roberts, G. S., Hoffman, C. A.*, Rivera-Rivera, L. A., Berman, S. E., Eisenmenger, L. B., & Wieben, O (2023). Automated Hemodynamic Assessment for Cranial 4D Flow MRI. Magnetic Resonance Imaging. 10.1016/j.mri.2022.12.016. *Roberts and Hoffman contributed equally to this work.
Leave a Comment
Your email address will not be published. Required fields are marked *